• 概述
  • 评论 (5)
  • 评论 (30)
  • 新特性

Volume by Price MT5

5

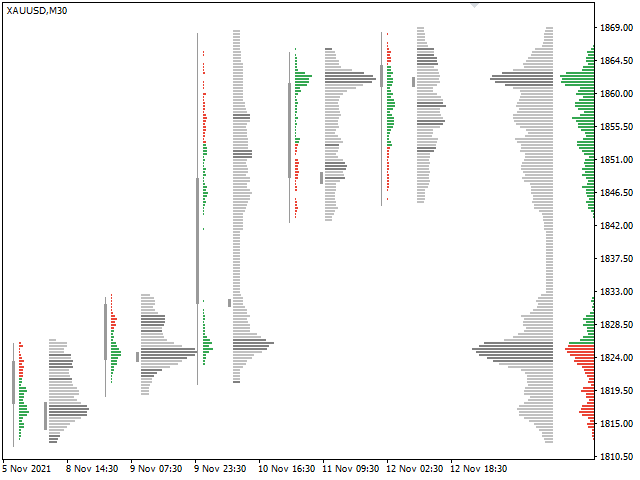
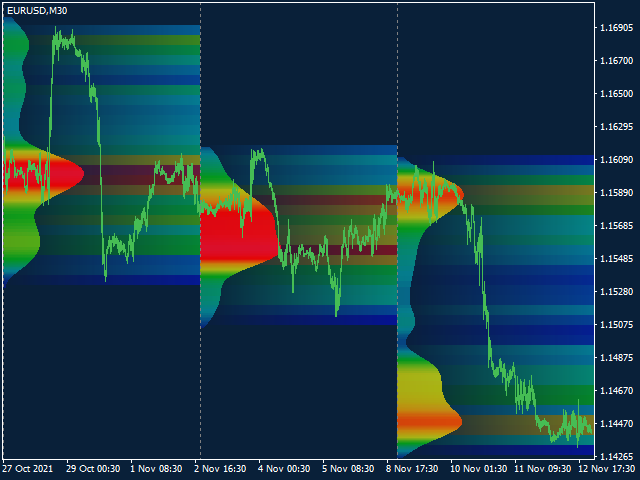
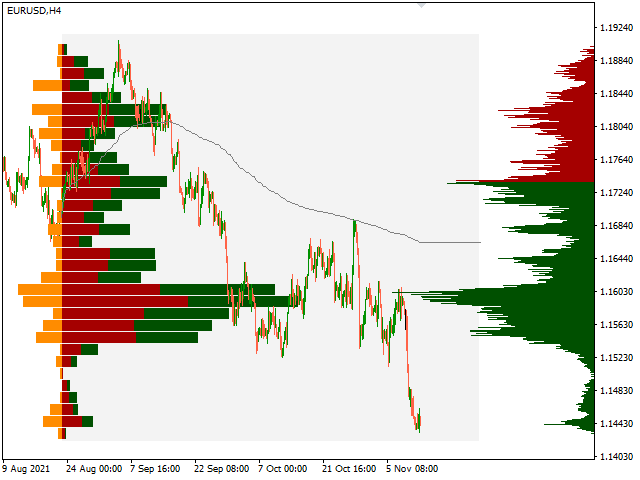
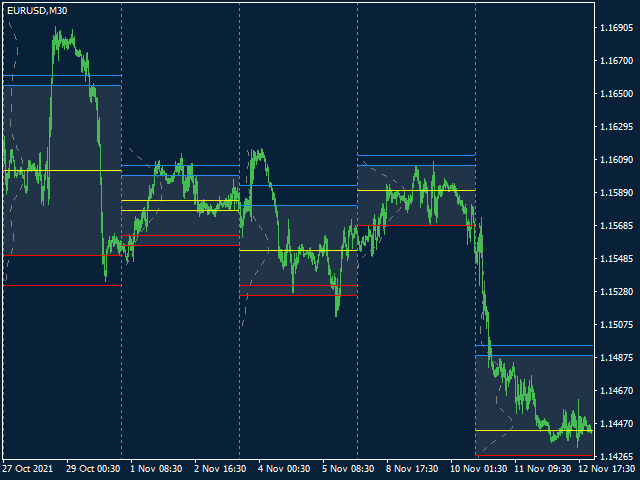
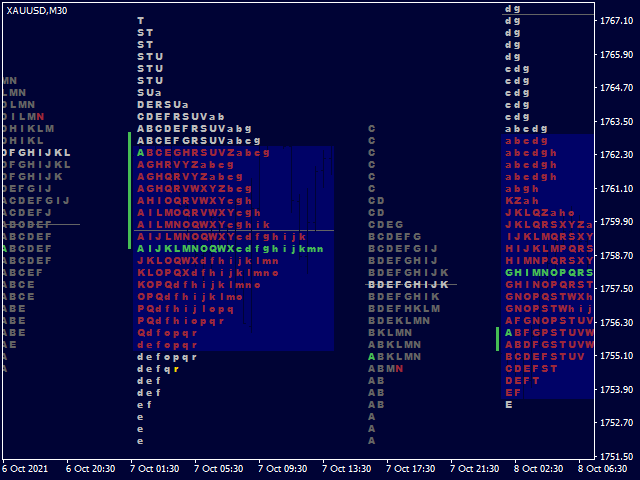
The Volume by Price Indicator for MetaTrader 5 features Volume Profile and Market Profile TPO (Time Price Opportunity). Get valuable insights out of currencies, equities and commodities data. Gain an edge trading financial markets.

Volume and TPO histogram bar, line and metric charts. TPO letter and block marker charts including split structures. Positioning and styling options to suit the user's needs and context.

Volume Profile and Market Profile TPO Point of Control (VPOC and TPOC), Imbalance, Value Area (VA) and High and Low Volume Nodes (HVN and LVN). Visualization and evaluation by multiple methods and a wide range of user-definable variables. Includes Initial Balance (IB) and Volume Weighted Average Price (VWAP). Additional Volume Time Statistics to perform Volume Spread Analysis (VSA) and Volume Price Analysis (VPA). Order book Time and Sales (T&S) and Depth Of Market (DOM) data connector extension for Order Flow and Footprint Analysis. Volume Profile Delta with classification by price action or order type.

A suite of technical analysis data visualization tools to display the complex relations between volume, price and time in various easy to interpret forms. Types of charts include change over time, part-to-whole, correlation and distribution. Data Source API by which users can have full control over the quality and type of data. Tick volume, trade volume or open interest. Data Environment API for programmatic access to dimensions and metrics for automated algorithmic trading strategies.

High-level chart setups with drag and drop support for the casual user, and further in-depth and segmented by using advanced user features.

For a quick start browse example compositions and download chart templates or set files. For details see documentation.


Also available Volume by Price MT4.

Free Demo: Distribution with chart timeframe period price data. Range of 200 bars. Up to 2 segments.

评论 5
Tyler Sanchez
518
Tyler Sanchez 2022.10.15 16:59 
 

An incredible idicator

João Cavalcante
536
João Cavalcante 2019.05.18 21:00 
 

Very versatile volume and market profile indicator indeed. Glad to have found it. It is the only one available in metatrader market capable of creating profiles with data concatenated from multiple contract months. Delighted to finally see such a feature. Other platforms seem to struggle to get it done. Surprised the mt4 version features it as well. Takes a while to setup and requires some pre-knowledge but as any futures trader knows profiles are most accurate if data from consecutive contract months is aggregated and selected by highest trade activity. Some of the futures traders I know won't even look at a profile which isn't.

推荐产品
Blahtech Market Profile MT5
Blahtech Limited
5 (8)
Was: $249    Now: $149   Market Profile defines a number of day types that can help the trader to determine market behaviour. A key feature is the Value Area, representing the range of price action where 70% of trading took place. Understanding the Value Area can give traders valuable insight into market direction and establish the higher odds trade. It is an excellent addition to any system you may be using. Blahtech Limited presents their Market Profile indicator for the MetaTrader community.
149 USD
本指标可以让您享受两个最流行的产品来分析在感兴趣的价位的请求量和市场成交量: 真实市场深度图表 真实报价足迹成交量图表 本产品结合两个指标的效力,并以单个文件提供。 反危机出售。今日低价。赶紧! 真实的 COMBO 市场深度功能和报价成交量图表,完全等同于原始指标。您将享受这两款产品结合为单一超级指标的力量!下面是您将得到的功能: 真实市场深度图表 股民专用工具现已在 MetaTrader 5 上可用。 真实市场深度图表 指标在图表上以直方条的形式显示可视化的市场深度,并在实时模式下刷新。 利用 真实市场深度图表 指标您可以正确评估市场请求并从图表上看到大的市场。这可以 100% 的精确剥头皮和设置持仓止损。 指标以两种相应颜色的水平直方条形式显示买和卖的请求 (买-卖)。价格图表上给定级别的显示条和它们的长度与请求的交易量相应。此外, 它指示买卖请求的最大交易量。 此指标显示买卖请求总数量作为堆积面积图。这可以评估当经过下一价位时将会执行的请求总量。买卖请求总数量也显示在图表上。 省缺, 指标显示在图表背景上, 且它不会干扰任何其它指标。当使用指标交易时, 建议使用实际交易量。
40 USD
Blahtech Supply Demand MT5
Blahtech Limited
4.54 (13)
Was: $299    Now: $149   Supply Demand uses previous price action to identify potential imbalances between buyers and sellers. The key is to identify the better odds zones, not just the untouched ones. Blahtech Supply Demand indicator delivers functionality previously unavailable on any trading platform. This 4-in-1 indicator not only highlights the higher probability zones using a multi-criteria strength engine, but also combines it with multi-timeframe trend analysis, previously confirmed swi
149 USD
BoxChart MT5
Evgeny Shevtsov
5 (6)
The market is unfair if only because 10% of participants manage 90% of funds. An ordinary trader has slim changes to stand against these "vultures". This problem can be solved. You just need to be among these 10%, learn to predict their intentions and move with them. Volume is the only preemptive factor that faultlessly works on any timeframe and symbol. First, the volume appears and is accumulated, and only then the price moves. The price moves from one volume to another. Areas of volume accumu
33 USD
该指标建立当前报价,可以与历史报价进行比较,并在此基础上进行价格走势预测。指示器有一个文本字段,用于快速导航到所需日期。 选项: 符号 - 选择指标将显示的符号; SymbolPeriod - 选择指标从中获取数据的时段; IndicatorColor - 指示器颜色; HorisontalShift - 由指标绘制的报价移动指定的柱数; Inverse - true 反转引号,false - 原始视图; ChartVerticalShiftStep - 图表垂直移动(键盘上的向上/向下箭头); 接下来是文本字段的设置,您可以在其中输入日期,您可以通过按“回车”立即跳转到该日期。 接下来是文本字段的设置,您可以在其中输入日期,您可以通过按“回车”立即跳转到该日期。
55 USD
VolumeProfile MT5
Robert Hess
3.57 (7)
Description: The Volume Profile displays detailed informations of historical trading activities at certain price levels (Market Profile). Locate the areas with the best prices in the market and get an advantage over other market participants. Support: The indicator is constantly being developed and improved. Please do not hesitate to contact me via the MQL5 Platform. I am very grateful about any Bug report, so that i can constantly improve the indicator. I appreciate any public review for this
140 USD
Magic Candles MT5
Evgeny Belyaev
4.71 (7)
Magic Candles MT5 是一种新产品,可以识别当前市场阶段(上升趋势、下降趋势或持平)。 该指标根据市场的当前状态以不同的颜色绘制条形图,并通过警报向用户发出有关趋势变化的信号。 Magic Candles MT5 非常适合交易货币(包括加密货币)和二元期权。 好处 适合剥头皮和日内交易。 指标不会重新绘制(重新计算),信号严格在“柱线收盘”时生成。 它可以作为独立工具使用,也可以与其他指标一起使用。 关于新指标信号的电子邮件和移动设备通知系统。 简单的指标设置,最少的参数。 适用于任何金融工具和市场。 产品使用方法 当最后一根蜡烛的颜色从灰色变为红色时,打开一个卖单(见截图 #1)。 当蜡烛颜色从灰色变为绿色时,打开卖单。 当灰色条出现时,关闭未平仓订单,如预期的那样。 参数 Zone BUY - 买入蜡烛的颜色(默认为绿色)。 Zone SELL - 卖出蜡烛的颜色(默认为红色)。 Neutral zone - 平面颜色(默认为灰色)。 Alert - 启用/禁用警报。如果 true - 启用,false - 禁用。 Email - 启
35 USD
UPD1 Profile Levels MT5
Vitaliy Kuznetsov
5 (2)
该指标在指定柱数的工作直方图上找到最大和最低价格量(市场概况)的水平。   复合型材 。 柱状图的高度是全自动的,并适应任何仪器和时间框架。 作者的算法被使用,并且不重复众所周知的类似物。 两个直方图的高度近似等于蜡烛的平均高度。 智能警报将帮助您了解有关交易量水平的价格。 概念Smart Money Low Volume - Imbalance. 用于寻找良好的市场环境,确定市场结构并作为二元期权的过滤器。 它是价格的磁铁。 High Volume - Liquidity. 用于退出累积时的测试。 输入参数 基本 Bars Count - 要计数和显示的条数 Signal Fractal = 5 (对于颜色信号电平)。 水平将在以下条件下成为信号:顶部和底部有五个直方图不超过它 Min Candles For High Volume Level - 在水平蜡烛的最小数量,以便它可以成为一个信号 按钮设置 Visual Button - 按钮显示(启用/禁用) Corner - 按钮的卡角 X indent - 以像素为单位的水平偏移量 Y indent - 以像素为单
45 USD
Ultimate Candle Patterns
Wojciech Daniel Knoff
This is a multi-symbol and multi-timeframe table-based indicator designed for a candlestick patterns detection with 46 patterns for META TRADER 5. Each formation has own image for easier recognition. Here you find most popular formations such as "Engulfing", "Hammer", "Three Line Strike", "Piercing" or Doji - like candles. Check my full list of patterns on my screenshots below. Also you can not only switch all bearish or bullish patterns from input, but also select formation for a specified symb
30 USD
Wapv Price and volume
Eduardo Da Costa Custodio Santos
40 USD
该指标的独特之处在于交易量核算算法:在所选时段内直接进行累积,而无需参考当天的开始。可以从计算中排除最后的柱线,那么当前数据对之前形成的显着水平(交易量)的影响较小。 为了更精确的计算,默认使用 M1 图表中的数据。规范了价格量的分配步骤。默认情况下,显示的右边框设置为用于分析的数据开头对应的栏,但如果需要,可以设置为您需要的栏。显示的音量带的长度(右边界)由系数调节,也可以向左或向右移动到 0(当前)条或参照当前条进行镜像。 参数: Accumulation period -  累积量计算周期 Number of excluded last bars - 从计算中排除的最后一根柱线的数量   Accumulation price step - 按价格参数的成交量总和步骤 Graph length multiplier -  显示数据的长度比例 Use data from timeframe - 用于分析的图表(时间范围) Graph show shift - 开始显示数据的移位,如果留为0,则数据将从分析数据周期开始时间对应的条开始显示; “-1”——显示在左侧; “-2” - 显示
35 USD
Welcome to the Ultimate Harmonic Patterns recognition indicator that is focused to detect advanced patterns. The Gartley pattern, Bat pattern, and Cypher pattern  are popular technical analysis tools used by traders to identify potential reversal points in the market. Our Ultimate Harmonic Patterns recognition Indicator is a powerful tool that uses advanced algorithms to scan the markets and identify these patterns in real-time. With our Ultimate Harmonic Patterns recognition Indicator, you
59 USD
Noize Absorption Index
Ekaterina Saltykova
Noize Absorption Index - is the manual trading system that measures the difference of pressure between bears forces and bulls forces. Green line - is a noize free index that showing curent situation. Zero value of index shows totally choppy/flat market.Values above zero level shows how powerfull bullish wave is and values below zero measures bearish forces.Up arrow appears on bearish market when it's ready to reverse, dn arrow appears on weak bullish market, as a result of reverse expectation.
199 USD
MaCandelsV1
Hicham Ait Taleb
The "MA_Candles" indicator is a customizable technical tool designed for the MetaTrader 5 trading platform. It enhances price chart analysis by visually representing candlesticks with distinct colors based on a moving average (MA) calculation. This indicator helps traders identify potential trend reversals and market sentiment shifts.  The "MA_Candles" indicator enhances MetaTrader 5 charts by coloring candlesticks based on a moving average (MA) calculation. It helps traders quickly identify
140 USD
Trading Utility for Forex Currency Pairs Only not for Gold  Functions Auto Lot Calculation based on Risk Auto stoploss  Auto TakeProfit Breakeven Auto Close Half % Close in percentage with respect to the PIPs Pending Orders BuyLimit Sell Limit with distances BuyStop Sell Stop    with distances Trading Informations Risk in percentage For Multiple trades Combine Takeprofit and Combine Stoplosses
30 USD
A "Volume Profile" is an advanced charting indicator that displays total volume traded at every price level over a user specified time period. The main components of the volume profile are POC ( Point Of Control - the price level, at which the maximum number of contracts were executed during a selected period), VAH ( Value Area High - the highest price in the Value Area) and VAL ( Value Area Low - the lowest price in the Value Area). When we settled on the original indicator, we spent a lot o
150 USD
Your Trend Friend
Luigi Nunes Labigalini
The trend is your friend! Look at the color of the indicator and trade on that direction. It does not  repaint. After each candle is closed, that's the color of the trend. You can focus on shorter faster trends or major trends, just test what's most suitable for the symbol and timeframe you trade. Simply change the "Length" parameter and the indicator will automatically adapt. You can also change the color, thickness and style of the lines. Download and give it a try! There are big movements
99 USD
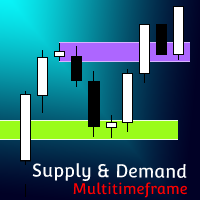
[ MT4 Version ] Supply and Demand Multitimeframe Supply and Demand Multitimeframe is the first indicator in the market that combines multiple aspects like trading volume, price structure and momentum to identify Supply and Demand zones for every asset. The Supply and Demand indicator analyzes simultaneously up to 4 different TFs and represents their information in the current graph. Its interactive UI highlights everytime the price enters a Supply or Demand zone even if the zones are not visible
224 USD
PipFinite Exit EDGE MT5
Karlo Wilson Vendiola
4.88 (34)
Did You Have A Profitable Trade But Suddenly Reversed? In a solid strategy, exiting a trade is equally important as entering. Exit EDGE helps maximize your current trade profit and avoid turning winning trades to losers. Never Miss An Exit Signal Again Monitor all pairs and timeframes in just 1 chart www.mql5.com/en/blogs/post/726558 How To Trade You can close your open trades as soon as you receive a signal Close your Buy orders if you receive an Exit Buy Signal. Close your Sell orde
88 USD
Strong Support mt5
Vasiliy Strukov
5 (9)
支撑位和阻力位长期以来一直是市场分析的有力工具。 强支撑指标绘制基于本地价格最低值的支撑水平,以及基于本地价格最大值的阻力水平。 我的其他发展可以在这里查看 建议与趋势指标一起使用,例如黄金-这将允许您根据趋势进行交易,同时确定整合或趋势反转区域,以及在支撑位和阻力位设置止损和获利。 购买后立即与我联系,以获得设置和个人奖金! 传入参数 - 指示器不需要复杂的设置,主要参数是色标的调整。 支撑位和阻力位长期以来一直是市场分析的有力工具。 强支撑指标绘制基于本地价格最低值的支撑水平,以及基于本地价格最大值的阻力水平。 我的其他发展可以在这里查看 建议与趋势指标一起使用,例如黄金-这将允许您根据趋势进行交易,同时确定整合或趋势反转区域,以及在支撑位和阻力位设置止损和获利。 购买后立即与我联系,以获得设置和个人奖金! 传入参数 - 指示器不需要复杂的设置,主要参数是色标的调整。
50 USD
ClusterSecond
Rafil Nurmukhametov
4.77 (30)
该工具允许绘制不同类型的图表。 秒图从1秒到86400秒 从1滴答开始的滴答图 成交量图 三角洲图 仁科图 范围图 用于体积分析的内置指标。 该工具的演示版 https://www.mql5.com/ru/channels/clustersecond 每日市场概况和所选时间框架的市场概况。 集群搜索。 不平衡。 VWAP。 动态POC、VAH、VAL 价格窗口简介 具有不同表现形式的垂直体积。 δ,有不同的可视化选项。 当前的和高的时间框架极 地下室指标烛台显示 也可以从图表中进行交易。 注意:该工具是为具有真实(交换)量的市场设计的。 它不适合外汇市场。它在VPS上不起作用。它在策略测试器中不起作用。 为了控制该图表,我们使用了 鼠标左键 - 移动图表,在设置中选择不同的模式,调用位于屏幕左下角带螺丝刀的钥匙图标下的主设置窗口。 鼠标右键 - 用于输入位于屏幕左上角图标下的图形结构的设置,以及绘制垂直、水平、趋势线和矩形的单独设置。 在图表区域旋转鼠标滚轮--左右移动图表,按住Ctrl键--上下移动图表,在价格比例区域--按价格比例,在时间轴区域--按时间比例。 H
100 USD
Before installing the HeatMap indicator make sure you are using a broker that gives you access to the Depth of market (DOM) !! This indicator creates a heatmap on your chart allowing you to see the buy or sell limit orders easily and in real time. You have the possibility to change the setting and the colors of the HeatMap in order to adapt to all markets and all charts. Here is an example of a setting you can use with the NASDAQ100 on the AMPGlobal broker :  https://www.youtube.com/watch?v=x0
80 USD
Order Flow Analytics
Thiago Nunes Bianchi
Order flow (tape reading)   analysis panel for real-time monitoring of buyers and sellers behavior using valuable tools: initial volume and recent volume (customizable parameter) of market orders by price levels with percentage comparison; initial volume and recent volume (customizable parameter) of limit orders renewals (order book renewals) by price levels with percentage comparison; volume of fleeting orders with percentage comparison; speed and volume averages (customizable parameters) of m
99 USD
Pico Trends
Nadiya Mirosh
Pico Trend   professional forex expert   (for EURUSD, GBPUSD, USDJPY, AUDUSD, USDCHF, EURGBP, EURJPY, NZDUSD, USDCAD, EURCHF, AUDJPY, CADJPY pairs)   alyzing the market using the Elliot Wave Index. Elliott wave theory is the interpretation of processes in financial markets through a system of visual models (waves) on price charts. The author of the theory, Ralph Elliott, identified eight variants of alternating waves (of which five are in the trend and three are against the trend). The moveme
1 333 USD
No Demand No Supply MT5
Trade The Volume Waves Single Member P.C.
No Demand No Supply   This indicator identifies   No Demand –No Supply candles  to your chart and plots volume bars colored according to the signal. It can be applied to all timeframes or to a specific one only. It can also be used as regular volume indicator  with exceptional future of WEIGHTED VOLUME. Furthermore is has an alert notification, sound and email when a signals occurs. The indicator does not repaint but the alert will come on two candles back due to the definition of No Demand No S
80 USD
Color Histogram Volume Set
Ricardo Almeida Branco
Do you use volume in your reading of the market? Certainly many traders use it, and do not imagine operating without it. The Color Histogram Volume Set indicator allows the user to choose the value that he considers interesting to monitor. When you pass this you will have visual confirmation and if you want you will also have the audible alert that is given by the indicator. Of course, there are other ways to try to find a high volume, such as assessing whether the volume
30 USD
FastAutolot MT5
Francesco Vitale
5 (2)
Introducing Autolot 2.0 Trade Management : The Revolutionary Trading Utility is Now Even MORE POWERFUL and EFFICIENT! We're proud to announce the launch of Autolot 2.0, the upgrade that takes your trading to a whole new level! We've listened to your feedback and improved the utility to make it even more versatile and user-friendly. Here are the key features we've added: Fixed Risk: Now you can set a fixed risk for your trades, regardless of the balance percentage. For example, in the settings,
80 USD
Each bar graph is a brick, take buy a bill now as an example, the brick that is in lowest position at the moment, go to the left, when the brick with the 3rd highest is in existence, take the height of this brick as a benchmark, when the price exceeds the height of this brick, can establish buy a bill, when appear opposite circumstance closes a position, establish empty order at the same time. This is a simple rule, need each friend grope by oneself.
100 USD
Gioteen Volatility Index (GVI) - your ultimate solution to overcoming market unpredictability and maximizing trading opportunities. This revolutionary indicator helps you in lowering your losing trades due to choppy market movements. The GVI is designed to measure market volatility, providing you with valuable insights to identify the most favorable trading prospects. Its intuitive interface consists of a dynamic red line representing the volatility index, accompanied by blue line that indicate
100 USD
该产品的买家也购买
IVISTscalp5
Vadym Zhukovskyi
5 (1)
我们向您介绍iVISTscalp5指标,它不仅独特,而且在交易操作中也非常有效。该指标基于时间数据,是多年金融市场经验和深入分析的结果。iVISTscalp5指标是手动交易的优秀工具。便利性、简单性和可视化 - 所有的复杂性都隐藏在内部。我们将iVISTscalp5指标的设置和使用简化到了最大程度。该指标适用于MT5终端中您所拥有的所有金融工具。 操作时间为UTC+3的早上4点到晚上8点。 iVISTscalp5指标菜单(见截图1): History - 计算行情的周数 dT_min - 选择时间间隔的时间(分钟) TFline - 绘制水平成交量(时间帧) BARSline - 绘制水平成交量(条数) TFtrend1 - 绘制日线通道(时间帧) BARStrend1 - 绘制日线通道(条数) TFtrend2 - 绘制周线通道(时间帧) BARStrend2 - 绘制周线通道(条数) ALERT_TIMER - 设置闹钟 ALERT - 开启/关闭闹钟 Save - 开启/关闭将时间记录到文本文件。 图表上的红色和蓝色旗帜表示时间(VIST智能剃须系统的信号)。卖出信号为红旗,买入
500 USD
PZ Harmonacci Patterns MT5
PZ TRADING SLU
3.25 (4)
可以说,这是您可以为MetaTrader平台找到的最完整的谐波价格形成自动识别指标。它检测19种不同的模式,像您一样认真对待斐波那契投影,显示潜在的反转区域(PRZ),并找到合适的止损和获利水平。 [ 安装指南 | 更新指南 | 故障排除 | 常见问题 | 所有产品 ] 它检测19种不同的谐波价格形态 它绘制了主要,衍生和互补的斐波那契投影(PRZ) 它评估过去的价格走势并显示每个过去的形态 该指标分析其自身的质量和性能 它显示合适的止损和获利水平 它使用突破来表明合适的交易 它在图表上绘制所有样式比率 它实现了电子邮件/声音/视觉警报 受斯科特·M·卡尼(Scott M. Carney)的书的启发,该指标旨在满足最纯粹和最熟练的交易者的需求。但是,它采取了一种使交易更容易的方式:在向交易发出信号之前,它会等待Donchian朝正确方向突破,从而使交易信号非常可靠。 斐波那契投影与向量无关 它实现了电子邮件/声音/推送警报 它绘制了ABCD投影 重要提示: 为了符合 Scott M. Carney先生 的商标申诉,某些图案名称已重命名为不言自明的替代方式, Scot
299 USD
VTrende Pro
Andrii Diachenko
VTrende Pro - MTF indicator for trend trading with a display panel for MT5 *** Videos can be translated into any language using subtitles (video language - Russian) Although the signals of the VTrende Pro indicator can be used as signals of a full-fledged trading system, it is recommended to use them in conjunction with the Bill Williams TS. VTrende Pro is an extended version of the VTrende indicator. Difference between Pro version and VTrende: - Time zones - Signal V - signal 1-2 waves
697 USD
Traffic Signal
Ramzi Abuwarda
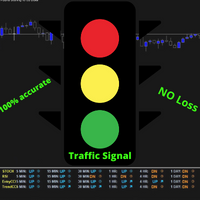
推出瞩目的MT5指标——交通信号,它基于分析RSI(相对强弱指标)、Stochastics(随机指标)、CCI(商品通道指标)和趋势等多个时间框架上的水平,以获取最准确的入场信号的特殊策略。交通信号是您成功交易的终极通道!该创新指标精确且专业,通过集成先进的技术指标,并覆盖所有时间框架,助您准确把握市场动向,为您提供无与伦比的自信心。 通过交通信号,您可以全面分析关键指标,经过精密校准,以探测最具利润潜力的交易机会。告别不确定性,迎接明智决策的新时代。交通信号将RSI、Stochastics、CCI和趋势等指标融合得天衣无缝,为您描绘市场动态提供鲜活画面,前所未有。 畅享轻松的市场趋势和模式,交通信号为您持续监测各个时间框架。无论您偏好短期激动还是长期战略,这一杰出指标均可满足您的交易风格,为您提供对市场起伏的整体认知。 交通信号的准确性是其成功的基石。通过广泛的研究与开发,该指标提供精确调校和时机准确的信号。告别虚假信号,迎接前所未有的可靠性水平。就像有一位可信赖的盟友与您并肩作战,以毫不动摇的准确性引导您走向丰盈机会。 通过直观的界面和易于理解的信号,您将体验到自信交易的乐趣。无论
450 USD
Weis Wave with Alert MT5
Trade The Volume Waves Single Member P.C.
4.93 (14)
Get 30% Discount until 30/9/20203 on Lifetime package 420$ from 599$. Rental/Lifetime Package Options and Privileges  * For optimum results the yearly or lifetime package is suggested due to live training and Discord  channel trading with the  creator! Rent Monthly Six Months   Yearly/Lifetime Weis Wave with Speed with Alert+Speed Index x x x Manual  x x x Quick Set up Video x x x Blog x x x Lifetime Updates x x x Setup and Training Material x x Free Rectangle Break Alert Tool      x Discord
420 USD
"Piranha" - an autonomous trading system that determines overbought and oversold levels on the chart. Red and blue zones represent overbought and oversold levels respectively. Entry points are marked with arrows: a downward arrow in the red zone for "sell" and an upward arrow in the blue zone for "buy". The Take profit level is indicated by the green moving average. Key features: Adjusting the Take profit level as the green moving average changes position. Averaging ability when a new market e
300 USD
Description Very precise patterns to detect: entry signals as well as breakout, support and resistance reversal patterns. It points out zones in which, with a high probability, institutional orders with the potential to change the price’s direction and keep moving towards it, have been placed. Support:   We create great tools for the entire trading community. Most of them are free. If you believe in what we do  Support Us Here.   KEY LINKS:   Indicator Manual  -  All Products  How is this ind
280 USD
INTRODUCING WORLD'S FIRST MT5 "AUTO SCALE" Naveen Geometric Square with Circle To Analyze Markets Geometric Relationship. Naveen's Geometric Square  has some of the most impressive features you will ever find in Gann & Geometric Analysis world. The Naveen's Geometric Square  is a Powerful method of squaring TIME AND PRICE .It is a free-hand drawing tool giving you control of the size of the box. The internal diagonals, grid-lines and angles can be Enabled/ Disabled. All square diagonals lik

1 299 USD
Incinerat8
Paulos Ngwenya
This algorithm uses real time data to generate signals with an accuracy rate of 80%. It shows entries and where you should place both the stoploss and the take profit for each trade. It determines trend! It can even help you to become a signal provider! And it can generate up to 8 signals a day! You get access to a free forex trading community  Operates on any broker compatible to synthetic indices and forex   if you need any assistance whatsapp +2774 35 35 744 or telegram link @pipsempire01
400 USD
Volume Confluence
Mussadiq Abdul Rahim
About Introducing our state-of-the-art technical analysis indicator that uses multiple sources from technical charts to predict the direction of price movement. This cutting-edge tool is designed to provide traders with accurate and reliable insights into potential market trends and price movements, enabling them to make informed decisions about their trades. By analyzing a range of key indicators, including price movement, volume, and trend lines, our indicator provides a comprehensive pict
1 000 USD
EQ Cutrim Theory
Marco Aurelio Santos Costa
Ronal Cutrim has been a dedicated mathematician for 14 years and has more than 10 years of experience in the financial market. The concept of the theory is simple, find imbalance between buyers and sellers. Which makes a lot of sense, because nothing goes up forever, nothing falls forever.   When you find an asset with a mathematical probability of unbalanced equilibrium, it is a great way to get into trading:  TUTORIAL: Turn on the subtitles, the video is subtitled
799 USD
Seconds Charts
Aleksandr Goryachev
Micro  ******************* Секундные графики MT5 ********************** Более точного инструмента для входа в сделку вы не найдёте. Входные параметры: Timeframe, sek - период построения графика, секунды Displayed bars - отображаемые бары Step of price levels, pp, 0-off - шаг отрисовки ценовых уровней, пункты Scale points per bar, 0-off - масштаб в пунктах на бар Show lines - отображение текущих уровней Show comment - отображение комментария Standard color scheme - стандартная цветовая сх
1 500 USD
Powerful Hidden Cross Signal
Ellan Dirgantara Tholkhah
The latest most requested Binary Options arrow indicator in the Garuda Signals product line is now on MT5! Binary options signal based on multiple time frame cross over analysis. Gets confirmation from the most consistent signals known to man; Ichimoku, SMA, Bollinger Bands; and also uses the 1 Hour time frame as trend confirmation , so you don't have to open up multiple chart and waste time. - Can be used for all time frames up to 1 hour, but is most POWERFUL for 1 and 5 min options. - Place yo
300 USD
Naked Forex Kangaroo Tail Pro Indicator Kangaroo Tail Pro Indicator is a pattern recognition indicator for Forex, Stocks, Indices, Futures, Commodities and Cryptos. The Kangaroo Tail is a multi-bar pattern. The Kangaroo Tail pattern is very effective and is very simple to trade. The strategy that comes with the Kangaroo Tail is based on price action. The indicator does what it was designed for: displaying Kangaroo Tail patterns.     Don't expect to follow the up and down arrows and make
299 USD
How to use Pair Trading Station Pair Trading Station is recommended for H1 time frame and you can use it for any currency pairs. To generate buy and sell signal, follow few steps below to apply Pair Trading Station to your MetaTrader terminal. When you load Pair Trading Station on your chart, Pair Trading station will assess available historical data in your MetaTrader platforms for each currency pair. On your chart, the amount of historical data available will be displayed for each currency pai
280 USD
Smooth price for Monarch
Konstantin Gruzdev
5 (1)
The Smooth Price technical indicator is used for plotting a smoothed line as close to the price of the financial instrument as possible, and serves to eliminate its noise components. The indicator is part of the Monarch trading system, but here it is presented as an independent technical analysis tool. The indicator is based on the cluster digital filter , which, unlike the ClusterSMA , is applied directly to the price time series. Smooth Price does not redraw (except the very last, zero bar) an
999 USD
Классификатор силы тренда. Показания на истории не меняет. Изменяется классификация только незакрытого бара. По идее подобен полной системе ASCTrend, сигнальный модуль которой, точнее его аппроксимация в несколько "урезанном" виде, есть в свободном доступе, а также в терминале как сигнальный индикатор SilverTrend . Точной копией системы ASCTrend не является. Работает на всех инструментах и всех временных диапазонах. Индикатор использует несколько некоррелируемых между собой алгоритмов для класси
6 250 USD
Currency Index Watcher is a simple and user-friendly tool for whoever wish to trade Forex using currencies indexes. Currency Index Watcher is configurable and usable directly from the panel. Indexes of 8 custom currencies EUR, USD, GBP, JPY, CHF, AUD, CAD, NZD (default) Any 3-chars symbol from your market watch could be used (BTC = bitcoin, RUB = ruble, CNH = yuan etc ...) : double click the symbol label  Ability to select which currencies and made-of pairs will be analyzed : check/uncheck want
360 USD
SmartTrendMt5
Andrey Spiridonov
The SmartTrendMt5 trend indicator generates signals based on the principle of combined analysis of calculated reference points within the Keltner channel. The indicator plots the Keltner channel in a separate window (by default, red lines and a blue line - the middle of the channel), and also draws the histogram of calculated reference points for each candle (by default, the histogram bars are yellow). The should be attached to a chart of any timeframe and any trading symbol in the usual way.
450 USD
Quantum Currency Strength Indicator for MT5
QUANTUM TRADING SOFTWARE LIMITED
If there is only one MT5 indicator you ever buy for trading forex – this has to be it. Your success as a forex trader depends on being able to identify when a currency or currency pair is oversold or overbought. If it is strong or weak. It is this concept which lies at the heart of forex trading. Without the Quantum Currency Strength indicator, it is almost impossible. There are simply too many currencies and too many pairs to do this quickly and easily yourself. You need help! The Quantum C
279 USD
Forex Relative Performance indicator This indicator calculates the relative strength of major currencies against the US dollar. The basic idea behind this indicator is "to buy strong currency and to sell weak currency". This indicator allows you to quickly identify the best forex pair to trade according to your trading style (Intraday, Scalping, Swing, or Long Term)
324 USD
SuavizadorDePrecio
Cesar Juan Flores Navarro
Funciona identificando picos de máximos y mínimos, para luego eliminarlos haciendo una linea o curva, pudiendo el usuario ingresar el valor de que tanto puede suavizar. Nos facilita poder ver la tendencia así como ver el cruce que puede hacer con otros indicadores, mostrando a simple vista los inicios y salidas de una tendencia u operación. Así también facilita la visualización de subidas y bajadas.
300 USD
Pendiente de Precio
Cesar Juan Flores Navarro
Indicador en base a la pendiente de la linea de precio, dibuja una línea de color cuando sube a base de los precios que previamente has sido procesados o linealizados, y cuando baja la pendiente la linea linealizada toma otro color. En este caso se a considerado 6 lineas de diferentes procesos desde pendientes largas hacia las cortas, observándose que cuando coincidan las pendientes se produce un máximo o mínimo, lo que a simple vista nos permitirá hacer una COMPRA O VENTA.
1 000 USD
WanaScalper
Isaac Wanasolo
1 (1)
A scalping indicator based on mathematical patterns, which on average gives signals with relatively small SL, and also occasionally helps to catch big moves in the markets (more information in the video) This indicator has three main types of notifications: The first type warns of a possible/upcoming signal on the next bar The second type indicates the presence of a ready signal to enter the market/open a position The third type is for SL and TP levels - you will be notified every time price r
1 350 USD
Индикатор Coefficient Of Determination (COD) представляет собой значение коэффициента детерминации или квадрат коэффициента корреляции между зависимой переменной — ценой и объясняющей переменной — тиковым объемом. Что это дает нам на практике? COD отлично распознает кульминацию трендовых движений, что позволяет подбирать оптимальные точки и ловить развороты рынка. Как использовать индикатор: Наиболее популярная торговая стратегия строится совместно с трендовым индикатором Moving Average (MA), пе
600 USD
Fibonacci Multiple 12
Cesar Juan Flores Navarro
Fibonacci Múltiple 12, utiliza la serie fibonacci plasmado en el indicador fibonacci, aumentadolo 12 veces según su secuencia. El indicador fibonacci normalmente muestra una vez, el presente indicador se mostrara 12 veces empezando el numero que le indique siguiendo la secuencia. Se puede utilizar para ver la tendencia en periodos cortos y largos, de minutos a meses, solo aumentado el numero MULTIPLICA.
1 000 USD
Recommended TimeFrame >= H1. 100% Non Repainted at any moment.  Use it carefully, only with Trend Direction. Trading Usage: 2 Variants: as Range System or as BreakOut System (Both Only With Trend Direction)::: (Always use StopLoss for minimise Risk); [1] as Range System: (Recommended) in UP TREND:  - BUY in Blue Line , then if price goes down by 50 points (on H1) open Second BUY.   Close in any Profit you wish: TrailingStop(45 points) or Close when Price touches upper Gold Line. in DOWN TR
5 500.95 USD
SWing3
AHMED KHALIFA AHMED ABULFATEH ALI ABULFATEH
5 (5)
一個取決於流動性和移動平均線的指標 > 它為您提供了 98% 的正確買入和賣出決策。以及關閉交易的時間。 PRICE 會不時增加 > 並且第一個 EA 何時啟動取決於此指標將超過 2k。 1-何時建立買入或賣出頭寸(取決於兩條線 X 的交叉點,點數計算取決於選擇的框架) (十字架應該在彩色區域之外)蠟燭必須在十字架期間或(第一個或第二個到第五個)之後接觸十字架 直接在十字下確認最後條件時計算的點數(見截圖表格..使用加號工具計算面積) 2-下一個區域外的黃線開始曲線是平倉信號 框架上的 3 件作品(1m 5m 10m 15m 30m 1h 4h 每天每周和每月)(所有對>和所有商品)專業推薦 4- 在獲得 ..(55%) 的收益後放置追踪止損 5 建議手 0.01 每筆交易為 1000 美元堆棧 分配不同對的位置示例:(usdjpy eurgbp gold) 6-有時蠟燭沒有觸及十字架(兩條線交叉如圖所示)但它高於預測賣出位置的十字架(其完美的賣出交易條件)(藍色區域,您正在等待賣出打開)注意: (應用所有先前的條件,沒有蠟燭觸摸條件) 7-有時蠟燭沒有觸及十字(兩條線如圖所示)但它
350 USD
Linea Horizontal Inteligente
Cesar Juan Flores Navarro
En base a cálculos matemáticos de determino una linea Horizontal que cruza a todas las señales de trading, mostrando los máximos y mínimos. La linea horizontal parte en dos las subidas y bajadas de las señales de trading, de tan manera que es fácil identificar los máximos y mínimos, y es inteligente por que es sensible a las subidas y bajadas, afín de no quedarse en un solo lado por siempre, trabaja excelentemente con otros indicadores suavizadores ya que les garantiza que en un intervalo de tie
1 000 USD
Mercadulls Trade
Gilberto Rodrigues
The   Mercadulls   Indicator gives to you many signals types, detecting supports, resistances and accumulation/distribution zones. The indicator constantly checks the graph for direct analysis and the appearance of long trends. Main characteristics No repaint! Stop loss and take profit levels are provided by the indicator. Suitable for Day Traders, Swing Traders, and Scalpers. Optimized algorithm to increase the accuracy of signals. Technical analysis indicator for all assets available in the m
280 USD
作者的更多信息
Volume by Price MT4
Brian Collard
5 (14)
The Volume by Price Indicator for MetaTrader 4 features Volume Profile and Market Profile TPO (Time Price Opportunity). Get valuable insights out of currencies, equities and commodities data. Gain an edge trading financial markets. Volume and TPO histogram bar, line and metric charts. TPO letter and block marker charts including split structures. Positioning and styling options to suit the user's needs and context. Volume Profile and Market Profile TPO Point of Control (VPOC and TPOC), Imbalanc
259 USD
筛选:
Marlonsadler
49
Marlonsadler 2023.04.25 14:58 
 

Hi, i bought this indicator and found it brilliant, is it possible to combine the default view with the Market Profile TPO singles and split structure. I tried to split the default view but it dont look like the Market Profile TPO singles and split structure. i want the histogram with the split letters. is there a way i could send a picture so you can see what i mean?

Tyler Sanchez
518
Tyler Sanchez 2022.10.15 16:59 
 

An incredible idicator

Adeshola Adeyinka
622
Adeshola Adeyinka 2020.06.20 05:55 
 

Well I haven't been able to use it and all support channels are not working. So I can't give an honest review till I put it to use. When I have used it I will review and allocate star ratings.

João Cavalcante
536
João Cavalcante 2019.05.18 21:00 
 

Very versatile volume and market profile indicator indeed. Glad to have found it. It is the only one available in metatrader market capable of creating profiles with data concatenated from multiple contract months. Delighted to finally see such a feature. Other platforms seem to struggle to get it done. Surprised the mt4 version features it as well. Takes a while to setup and requires some pre-knowledge but as any futures trader knows profiles are most accurate if data from consecutive contract months is aggregated and selected by highest trade activity. Some of the futures traders I know won't even look at a profile which isn't.

dbaumann
38
dbaumann 2019.04.30 01:36 
 

用户没有留下任何评级信息

回复评论
版本 8.502 2023.06.15
• Improved functions for 'Style Main Line'
版本 8.498 2023.06.13
• Improved functions for 'Style Panel'
版本 8.496 2023.06.12
• Improved functions for 'Style Main Line'
版本 8.316 2023.06.08
• Improved graphics
版本 8.314 2023.06.05
• Stability and performance improvements
版本 8.312 2023.06.01
• Accessibility improvements
版本 8.310 2023.06.01
• Performance improvements
版本 8.204 2023.05.24
• Improved functions for 'Object Position'
• Improved functions for 'Dataset Segment'
版本 8.198 2023.05.22
• Improved graphics
版本 8.102 2023.05.01
• Improved functions for 'Interface Data Environment'
版本 8.0 2023.05.01
• Improved defaults
版本 7.998 2023.05.01
• Improved graphics
版本 7.996 2023.05.01
• Accessibility improvements
版本 7.994 2023.04.28
• Accessibility improvements
版本 7.993 2023.04.28
• Support for new extensions and resources
• Accessibility improvements
版本 7.991 2023.04.04
• Improved graphics
版本 7.987 2023.04.01
• Improved graphics
版本 7.985 2023.03.29
• Improved graphics
版本 7.975 2023.03.27
• Stability and performance improvements
版本 7.973 2022.11.15
• Support for new extensions
版本 7.972 2022.11.15
• Accessibility improvements
版本 7.970 2022.11.13
• Stability and performance improvements
版本 7.968 2022.11.11
• Stability and performance improvements
版本 7.962 2022.11.07
• Stability and performance improvements
版本 7.946 2022.11.03
• Stability and performance improvements
版本 7.942 2022.10.28
• Improved presets for 'Panel'
版本 7.941 2022.10.28
• Support for new resources
版本 7.940 2022.10.28
• Improved functions for 'Interface Data Source'
版本 7.931 2022.10.26
• Support for new extensions
版本 7.927 2022.10.25
• Accessibility improvements
版本 7.926 2022.10.25
• Improved resources
版本 7.924 2022.10.24
• Stability and performance improvements
版本 7.920 2022.10.21
• Stability and performance improvements
版本 7.918 2022.10.19
• Improved functions for 'Interface Data Source'
版本 7.914 2022.10.17
• Improved functions for 'Style Main Histogram'
版本 7.912 2022.10.17
• Support for new resources
版本 7.910 2022.10.17
• Improved functions for 'Style Column'
版本 7.902 2022.10.17
• Improved functions for 'Object Position'
版本 7.896 2022.10.10
• Support for new extensions
版本 7.895 2022.10.10
• Stability and performance improvements
版本 7.893 2022.10.06
• Improved resources
版本 7.892 2022.10.06
• Improved graphics
版本 7.891 2022.10.02
• Support for new resources
版本 7.890 2022.10.02
• Improved functions for 'Dataset Segment'
• Improved functions for 'Interface On-Chart Controls'
版本 7.850 2022.09.26
• Improved functions for 'Dataset'
版本 7.810 2022.09.24
• Stability and performance improvements
版本 7.808 2022.09.23
• Improved resources
版本 7.807 2022.09.22
• Improved graphics
版本 7.805 2022.09.20
• Performance improvements
版本 7.802 2022.09.15
• Support for new extensions
版本 7.799 2022.09.13
• Support for new resources
版本 7.798 2022.09.12
• Improved functions for 'Dataset'
版本 7.795 2022.09.10
• Improved functions for 'Interface Data Source'
版本 7.793 2022.09.04
• Improved functions for 'Interface Data Environment'
版本 7.792 2022.09.04
• Improved graphics
版本 7.791 2022.09.04
• Support for new resources
版本 7.790 2022.09.03
• Stability and performance improvements
版本 7.786 2022.08.29
• Improved resources
版本 7.785 2022.08.29
• Accessibility improvements
版本 7.765 2022.08.10
• Improved functions for 'Dataset'
版本 7.764 2022.08.10
• Improved functions for 'Interface Data Environment'
版本 7.762 2022.08.08
• Support for new resources
版本 7.761 2022.08.07
• Improved graphics
版本 7.760 2022.08.07
• Support for new resources
版本 7.759 2022.08.07
• Stability and performance improvements
版本 7.756 2022.08.05
• Stability and performance improvements
版本 7.754 2022.07.31
• Accessibility improvements
版本 7.752 2022.07.29
• Improved presets for 'Column'
版本 7.750 2022.07.27
• Improved functions for 'Dataset'
版本 7.740 2022.07.25
• Stability and performance improvements
版本 7.739 2022.07.24
• Improved functions for 'Interface Data Environment'
• Improved presets for 'Panel'
版本 7.712 2022.07.11
• Support for new resources
版本 7.711 2022.07.10
• Performance improvements
版本 7.709 2022.07.06
• Improved functions for 'Dataset'
版本 7.654 2022.06.28
• Improved functions for 'Panel'
版本 7.653 2022.06.27
• Stability and performance improvements
版本 7.652 2022.06.27
• Stability and performance improvements
版本 7.651 2022.06.27
• Support for new resources
版本 7.650 2022.06.26
• Improved functions for 'Dataset Segment'
版本 7.601 2022.06.20
• Improved graphics
版本 7.600 2022.06.20
• Accessibility improvements
版本 7.590 2022.06.15
• Performance improvements
版本 7.560 2022.05.23
• Accessibility improvements
版本 7.550 2022.05.23
• Accessibility improvements
版本 7.540 2022.05.15
• Accessibility improvements
版本 7.530 2022.05.14
• Accessibility improvements
版本 7.520 2022.04.18
• New 'TPO' parameter for 'Evaluation Column'
• Improved functions for 'Interface Data Environment'
版本 7.509 2022.04.06
• Accessibility improvements
版本 7.508 2022.04.04
• Support for new resources
版本 7.507 2022.04.03
• Accessibility improvements
版本 7.506 2022.03.08
• Accessibility improvements
版本 7.504 2022.03.04
• Improved functions for 'Style Indication'
版本 7.502 2022.03.03
• Performance improvements
版本 7.501 2022.03.03
• Stability and performance improvements
版本 7.499 2022.03.02
• Improved functions for 'Text'
版本 7.498 2022.03.02
• New 'Size' parameters for 'Style Main' and 'Style Column'
版本 7.495 2022.03.01
• Improved presets for 'Column'
版本 7.490 2022.02.27
• New 'Volume' and 'Price Level' parameters for 'Evaluation'
• Improved functions for 'Style Main'
• Improved presets for 'Dataset'
版本 7.410 2022.02.25
• Improved functions for 'Style Column'
• Fix for multi timeframe data load issue on platform restart
版本 7.405 2022.02.22
• New 'Actual Price Level' preset for 'Panel'
版本 7.400 2022.02.22
• New 'Price Level Grid' parameter for 'Dataset'
版本 7.370 2022.01.06
• Support for new resources
• Improved graphics
版本 7.360 2021.12.11
• New 'Area' option for 'Indication Column'
• New 'Volume' parameter for 'Evaluation Column'
版本 7.350 2021.12.09
• Support for new resources
• Improved 'Market Profile (TPO) - Histogram' option for 'Main'
版本 7.340 2021.12.06
• New 'History' parameter for 'Dataset'
• New 'Padding' parameter for 'Style Column'
• Accessibility improvements
版本 7.310 2021.12.02
• Support for new resources
• Improved functions for 'Main'
版本 7.300 2021.11.30
• New 'Direction' parameter for 'Main'
• New 'Market Profile (TPO) - Histogram' option for 'Main'
• New 'Ray' and 'Color' parameters for 'Style Highlight Line' and 'Style Highlight Background Fill'
• New 'Line' options for 'Highlight Main'
• New 'Label' parameters for 'Style Highlight Line'
• Fix for templates issue
• New 'Anchor' parameter options for 'Panel'
• Improved defaults for 'Evaluation HVN/LVN'
版本 7.190 2021.11.24
• Stability and performance improvements
版本 7.103 2021.11.22
• Accessibility improvements
版本 7.0 2021.11.19
several improvements
版本 6.191 2021.07.06
fixed issue string value parameter (input as file)
版本 6.190 2021.07.05
feature update (data environment)
several improvements
reset parameter default values
版本 6.112 2021.06.27
several improvements
presets update
版本 6.110 2021.06.25
several improvements
版本 6.109 2021.06.24
several improvements
版本 6.108 2021.06.23
several improvements
版本 6.107 2021.06.21
several improvements
版本 6.105 2021.06.20
several improvements
版本 6.101 2021.06.17
several improvements
版本 6.1 2021.06.15
several improvements
版本 6.0 2021.06.12
feature upgrades
reorder parameters
版本 5.912 2021.03.12
extended drawing functions

performance improvements
版本 5.910 2021.03.08
extended data functions (time range method)
版本 5.909 2021.03.07
several improvements
extended data functions (market profile)
版本 5.900 2021.03.04
several improvements
extended data functions (price zone labels)
版本 5.897 2021.03.02
several improvements
extended data functions (volume time statistics)
improvements strategy tester / free demo
reset parameter default values
版本 5.895 2021.03.01
several improvements
fixed issue drawing function (market profile - expanded structure)
presets update (example setting files)
版本 5.893 2021.03.01
extended data functions (time range method)
extended drawing functions (market profile - block marker)
reorder parameters
版本 5.845 2021.02.27
several improvements
user manual update
版本 5.843 2021.02.27
extended drawing functions (highlight option)
版本 5.842 2021.02.27
performance improvements
presets update (example setting files)
reset parameter default values
版本 5.839 2021.02.26
several improvements
版本 5.838 2021.02.26
extended data functions (session filter)
版本 5.833 2021.02.25
several improvements
extended drawing functions (update rates)
版本 5.830 2021.02.24
feature upgrade
extended data functions (volume time statistics - segment)
版本 5.821 2021.02.23
fixed issue drawing function (vp scale by chart)
版本 5.820 2021.02.23
extended drawing functions
improvements strategy tester / free demo
版本 5.810 2021.02.22
extended data functions (time statistics option)
版本 5.809 2021.02.22
several improvements
presets update (example setting files)
版本 5.807 2021.02.21
reset parameter default values
performance improvements
版本 5.806 2021.02.21
several improvements
版本 5.802 2021.02.19
several improvements
版本 5.800 2021.02.18
extended drawing functions
bug fixes and performance improvements
presets update (chart color schemes)
reset parameter default values
版本 5.652 2021.02.17
several improvements
版本 5.641 2021.02.14
extended data functions (market profile - dynamic)
presets update (built-in)
user manual update
版本 5.631 2021.02.12
several improvements
presets update (example setting files)
版本 5.622 2021.02.10
several improvements
版本 5.621 2021.02.10
several improvements
extended data functions (volume time statistics - segment)
版本 5.617 2021.02.08
several improvements
版本 5.614 2021.02.08
several improvements
presets update (setting files)
版本 5.611 2021.02.08
extended data functions (time range option)
版本 5.606 2021.02.06
several improvements
版本 5.604 2021.02.04
reset parameter default values
版本 5.603 2021.02.04
performance improvements
版本 5.601 2021.02.03
extended drawing functions (vwap)
版本 5.598 2021.02.03
several improvements
reset parameter default values
版本 5.596 2021.02.03
several improvements
版本 5.593 2021.02.01
several improvements
版本 5.590 2021.02.01
extended drawing functions (volume time statistics - mtf)
presets update (setting files)
版本 5.521 2021.01.28
performance improvements
版本 5.517 2021.01.28
several improvements
extended data functions (range bar)
版本 5.514 2021.01.28
several improvements
版本 5.510 2021.01.28
extended data functions (volume time statistics - mtf)
extended drawing functions (market profile)
版本 5.490 2021.01.27
extended data functions (market profile)
extended drawing functions (volume time statistics)
版本 5.460 2021.01.26
several improvements
版本 5.452 2021.01.25
several improvements
extended data functions (time range option)
版本 5.450 2021.01.25
performance improvements
extended data functions
版本 5.218 2021.01.24
several improvements
extended data functions (update rates)
user manual update
版本 5.208 2021.01.23
reset parameter default values
user manual update
presets update (setting files)
版本 5.207 2021.01.22
several improvements
presets update (setting files)
版本 5.206 2021.01.22
presets update (setting files)
版本 5.205 2021.01.22
reset parameter default values
extended drawing functions (line highlights)
版本 5.204 2021.01.21
extended drawing functions (mp marker block)
版本 5.203 2021.01.18
extended data functions (market profile - dynamic)
版本 5.202 2021.01.18
extended data functions (time range option)
版本 5.201 2021.01.17
presets update (built-in)
improvements strategy tester / free demo
版本 5.199 2021.01.16
user manual update
版本 5.198 2021.01.16
improvements strategy tester / free demo
版本 5.197 2021.01.16
several improvements
extended data functions (market profile)
版本 5.195 2021.01.15
several improvements
extended data functions (session filter)
版本 5.193 2021.01.13
several improvements
resources update
版本 5.192 2021.01.10
user manual update
presets update (setting files)
版本 5.191 2021.01.09
several improvements
user manual update
版本 5.190 2021.01.08
several improvements
reset parameter default values
presets update (setting files)
版本 5.163 2020.07.08
several improvements
reset parameter default values
版本 5.162 2020.07.07
several improvements
版本 5.161 2020.05.04
extended data functions
performance improvements
版本 5.159 2020.05.03
feature update
performance improvements
版本 5.152 2020.05.01
several improvements
版本 5.150 2020.05.01
feature upgrade
extended data functions (highlight method)
presets update (setting files)
版本 5.141 2020.04.30
several improvements
版本 5.140 2020.04.30
feature update
版本 5.137 2020.04.29
extended data functions (time range segmentation method)
版本 5.135 2020.04.28
extended data functions (time range update rate)
performance improvements
版本 5.134 2020.04.27
performance improvements
版本 5.133 2020.04.27
several improvements
版本 5.132 2020.04.21
several improvements
版本 5.131 2020.04.20
several improvements
版本 5.130 2020.04.20
extended drawing functions (mp marker block size scale non-uniform)
reset parameter default values
presets update (setting files)
版本 5.120 2020.04.18
feature upgrade
extended data functions (time range segmentation method)
reset parameter default values
presets update (setting files)
版本 5.118 2020.04.14
extended data functions (time range segmentation method)
presets update (setting files)
版本 5.116 2020.04.13
several improvements
presets update (setting files)
版本 5.115 2020.04.13
extended data functions (time range option)
版本 5.113 2020.04.10
extended data functions (time range options and update rate)
reset parameter default values
presets update (setting files)
版本 5.112 2020.04.04
presets update
版本 5.110 2020.04.03
extended drawing functions
reset parameter default values
版本 5.109 2020.04.02
feature update
reset parameter default values
presets update (setting files)
版本 5.108 2020.03.31
performance improvements
reset parameter default values
版本 5.107 2020.03.30
feature update
版本 5.106 2020.03.29
extended data functions
版本 5.105 2020.03.27
presets update
chart script update
版本 5.104 2020.03.27
several improvements
版本 5.103 2020.03.25
feature upgrade
reset parameter default values
presets update
版本 5.99 2020.03.16
several improvements
版本 5.98 2020.03.15
extended data functions
extended drawing functions
版本 5.97 2020.03.14
presets update (built-in)
版本 5.96 2020.03.13
several improvements
版本 5.95 2020.03.12
several improvements
版本 5.94 2020.02.17
several improvements
版本 5.93 2020.02.10
extended data functions
performance improvements
版本 5.91 2020.02.09
extended data functions
版本 5.90 2020.02.09
several improvements
reset parameter default values
presets update
版本 5.89 2020.02.08
several improvements
版本 5.88 2020.02.05
performance improvements
版本 5.87 2020.02.05
presets update (built-in)
版本 5.86 2020.02.05
several improvements
版本 5.85 2020.02.05
several improvements
reset parameter default values
presets update
版本 5.84 2020.02.04
several improvements
版本 5.83 2020.02.04
extended data functions
版本 5.82 2020.02.04
several improvements
版本 5.81 2020.02.03
feature update
extended data functions
版本 5.78 2020.02.01
feature update
extended data functions
extended drawing functions
reset parameter default values
presets update
版本 5.76 2020.01.31
several improvements
reset parameter default values
版本 5.75 2020.01.30
reset parameter default values
版本 5.74 2020.01.30
feature updates
extended data functions
extended drawing functions
reset parameter default values
presets update
版本 5.65 2020.01.22
feature upgrade
extended drawing functions
presets update
版本 5.62 2020.01.21
performance improvements
presets update
版本 5.61 2020.01.21
performance improvements
presets update
版本 5.60 2020.01.21
feature updates
extended drawing functions
reset parameter default values
presets update
版本 5.57 2020.01.19
several improvements
版本 5.56 2020.01.19
feature update
extended drawing functions
版本 5.54 2020.01.19
performance improvements
版本 5.53 2020.01.18
feature upgrade
版本 5.52 2020.01.18
performance improvements
版本 5.49 2020.01.17
several improvements
版本 5.47 2020.01.17
feature updates
extended drawing functions
extended data functions
performance improvements
reset parameter default values
版本 5.45 2020.01.16
performance improvements
版本 5.40 2020.01.15
feature update
extended drawing functions
reset parameter default values
presets update
版本 5.38 2020.01.14
feature update
extended data functions
reset parameter default values
版本 5.37 2020.01.13
performance improvements
版本 5.36 2020.01.13
feature update
版本 5.35 2020.01.12
several improvements
reset parameter default values
版本 5.34 2020.01.11
several improvements
版本 5.33 2020.01.10
feature upgrade
extended data functions
extended drawing functions
reset parameter default values
presets update
版本 5.27 2020.01.08
feature upgrade
extended data functions
extended drawing functions
reset parameter default values
presets update
版本 5.24 2020.01.06
feature upgrade
extended data functions
extended drawing functions
reset parameter default values
presets update
版本 5.22 2020.01.05
performance improvements
版本 5.21 2020.01.04
feature upgrade
extended drawing functions
版本 5.20 2020.01.04
several improvements
版本 5.19 2020.01.03
several improvements
reset parameter default values
presets update
版本 5.18 2020.01.02
several improvements
版本 5.17 2020.01.02
reset parameter default values
版本 5.16 2020.01.02
feature upgrade
extended data functions
extended drawing functions
版本 5.15 2019.12.30
feature upgrade
版本 5.14 2019.12.28
performance improvements
版本 5.13 2019.12.27
several improvements
版本 5.12 2019.12.27
feature updates
extended data functions
several improvements
reset parameter default values
版本 5.10 2019.12.24
explicitly set encoding for string conversion operations
版本 5.8 2019.12.24
feature update
reset parameter default values
版本 5.7 2019.12.22
feature upgrade
parameters update
版本 5.6 2019.12.21
feature upgrade
several improvements
reset parameter default values
presets update
版本 5.5 2019.12.20
extended drawing functions
reset parameter default values
版本 5.4 2019.12.20
extended drawing functions
版本 5.3 2019.08.01
feature update
extended data functions
版本 5.2 2019.07.20
feature update
版本 5.0 2019.07.19
final checks
版本 4.102 2019.07.11
feature update
版本 4.101 2019.07.09
feature update
版本 4.99 2019.07.08
several improvements
版本 4.98 2019.07.07
feature upgrade
various feature updates
extended drawing and data functions
reset parameter default values
版本 4.96 2019.06.20
several improvements
版本 4.95 2019.06.20
several improvements
版本 4.93 2019.06.14
feature update
版本 4.92 2019.06.14
several improvements
版本 4.90 2019.06.13
reset parameter default values
版本 4.89 2019.06.13
feature upgrades
版本 4.78 2019.06.09
various feature updates
reset parameter default values
版本 4.74 2019.06.07
extended drawing functions
版本 4.71 2019.06.06
extended drawing functions
performance improvements
版本 4.70 2019.06.05
feature update
版本 4.69 2019.06.05
several improvements
版本 4.67 2019.06.04
performance improvements
版本 4.66 2019.06.04
feature update
several improvements
版本 4.63 2019.06.02
several improvements
版本 4.62 2019.06.02
extended drawing functions
版本 4.61 2019.06.02
extended drawing functions
performance improvements
版本 4.58 2019.05.31
several improvements
reset parameter default values
版本 4.57 2019.05.31
feature upgrade
extended drawing functions
版本 4.45 2019.05.30
feature update
several improvements
版本 4.41 2019.05.27
various feature updates and upgrades
extended drawing and data functions
performance improvements
reset parameter default values
版本 4.1 2019.05.22
extended data functions
版本 4.0 2019.05.21
various feature updates
extended drawing functions
reset parameter default values
版本 3.106 2019.05.21
several improvements
版本 3.104 2019.05.19
feature upgrade
various feature updates
reset parameter default values
版本 3.98 2019.05.17
feature upgrade
版本 3.97 2019.05.16
several improvements
updated various parameter defaults
版本 3.96 2019.05.16
performance improvements
extended drawing functions
版本 3.95 2019.05.15
feature upgrade
版本 3.93 2019.05.15
various feature updates
reset parameter default values
版本 3.91 2019.05.14
several improvements
版本 3.89 2019.05.13
various feature updates
reset parameter default values
版本 3.87 2019.05.13
updated various parameter defaults
版本 3.86 2019.05.13
feature upgrade
various feature updates
reset parameter default values
版本 3.61 2019.05.10
several improvements
版本 3.59 2019.05.06
various feature updates
reset parameter default values
版本 3.57 2019.05.02
several improvements
版本 3.56 2019.04.29
various feature updates
版本 3.54 2019.04.29
several improvements
版本 3.53 2019.04.29
feature upgrade
版本 3.51 2019.04.26
feature upgrade
版本 3.48 2019.04.26
various feature updates
版本 3.44 2019.04.24
performance improvements
版本 3.43 2019.04.24
several improvements
reset parameter default values
版本 3.42 2019.04.23
feature upgrade
版本 3.36 2019.04.21
feature upgrade
版本 3.33 2019.04.20
performance improvements
版本 3.32 2019.04.20
several improvements
reset parameter default values
版本 3.31 2019.04.20
feature upgrade
版本 3.29 2019.04.19
feature upgrade
版本 3.28 2019.04.18
various feature updates
版本 3.27 2019.04.17
extended drawing functions
版本 3.26 2019.04.17
performance improvements
版本 3.25 2019.04.16
performance improvements
版本 3.24 2019.04.16
several improvements
版本 3.23 2019.04.16
various feature updates
版本 3.22 2019.04.15
performance improvements
版本 3.21 2019.04.15
feature upgrade
版本 3.17 2019.04.14
several improvements
版本 3.16 2019.04.14
various feature updates
reset parameter default values
版本 3.15 2019.04.13
several improvements
版本 3.13 2019.04.13
performance improvements
版本 3.11 2019.04.12
feature upgrade
various feature updates
版本 3.7 2019.04.10
several improvements
版本 3.5 2019.04.08
various feature upgrades
版本 3.1 2019.04.05
changed various parameter defaults
版本 3.0 2019.04.05
various feature upgrades
performance improvements
版本 2.49 2019.04.04
various feature updates
版本 2.44 2019.04.03
feature upgrade
版本 2.41 2019.04.03
feature upgrade
版本 2.39 2019.04.01
feature upgrade
版本 2.37 2019.04.01
several improvements
版本 2.36 2019.04.01
various feature updates
版本 2.34 2019.03.30
several improvements
版本 2.33 2019.03.29
various feature updates
版本 2.32 2019.03.28
several improvements
版本 2.31 2019.03.26
feature upgrade
版本 2.30 2019.03.26
several improvements
版本 2.26 2019.03.22
various feature upgrades
版本 2.24 2019.03.20
extended data functions
版本 2.22 2019.03.20
extended drawing functions
版本 2.21 2019.03.19
performance improvements
版本 2.20 2019.03.19
various feature upgrades
版本 2.18 2019.03.18
changed parameter 'Buffer Limit' default to max
版本 2.17 2019.03.18
several improvements
版本 2.16 2019.03.18
several improvements
版本 2.15 2019.03.17
various feature upgrades
版本 2.3 2019.02.26
extended drawing functions
版本 2.1 2019.02.24
added input parameter "Draw Height Subtract"
added input parameter "Draw Anchor, Time"
版本 2.0 2019.02.22
performance improvements
extended drawing functions
版本 1.9 2019.02.22
performance improvements
extended drawing functions
added input parameter "Border Merge"
版本 1.8 2019.02.21
fixed incorrect link properties
版本 1.7 2019.02.20
added new feature "Snap Time"
版本 1.5 2019.02.18
improvements strategy tester
various feature updates
版本 1.3 2019.02.15 http://ea666.cn
stability and performance improvements
fixed issue strategy tester
版本 1.2 2019.02.12
updated description and link properties
版本 1.1 2019.02.11
stability and performance improvements
fixed issue initial drawing