Bill Williams Advanced
- 指标
- Siarhei Vashchylka
- 版本: 1.4
- 更新: 12 七月 2023
- 激活: 10
Bill Williams Advanced is designed to analyze the chart according to Bill Williams' Profitunity system. The indicator analyzes the signals of the AO, AC indicators and places them in the panel in the upper left corner of the chart. In addition, using hot keys, the indicator instantly displays / hides the AO and AC indicators (for more details, see the video instructions).
Description
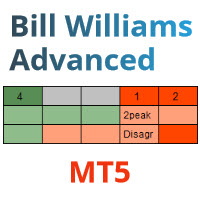
Each line of the indicator table represents the signals of the Profitunity system that are valid on the last five bars on the chart from right to left.
Zones(First line)
In the first line, the indicator builds zones based on the AO and AC indicators. If we observe the closing of a bar on the price chart with a green bar of AO and AC, then the zone is colored green, if the closing of the bar corresponds to the red bars of AO and AC, then the zone is colored red. If one of the indicators is green and the other is red, then the zone becomes gray.
Zones are displayed from right to left like bars on the price chart. The first column on the right in the table corresponds to the last closed bar on the price chart. The second column on the right corresponds to the penultimate closed bar on the price chart, and so on.
On each closed signal of the zone, you can observe numbers from 1 and higher. They indicate the age of the zone. That means the number of bars on which we observe a zone of the same color in a row. When changing colors, the count is reset to zero and starts over. There are no numbers within the gray zone.
AO indicator (Second line)Within the second line, the signals of the AO indicator are displayed. Each rectangle of the second line corresponds to one of the last closed columns of the AO indicator. For example, the first column in the table on the right corresponds to the last closed column of AO, the second column on the right corresponds to the penultimate column of AO, and so on.
The AO indicator is represented by three signals:
- Crossing the zero line (Cross on the indicator panel)
- Saucer (Sau on display panel)
- Two Peaks (2Peak on the indicator panel)
Each of these signals is displayed on the bar to which it corresponds. For example, if we see that the first rectangle on the right is red and Sau is written on it, then this means that the last closed bar on the current price range gave a Saucer sell signal.
AC indicator (Third line)
The logic of constructing the third line is identical to the second one, except that the signals of the AC indicator are displayed.
The AC indicator is represented by the following signals:
- Buy/Sell according to the Momentum (Agr on the indicator bar)
- Buy/Sell Against Momentum (Disagr on the indicator bar)
- Buy/Sell when crossing the zero line (Cross on the indicator panel)
AO and AC indicators
The important tasks of the Bill Williams Advanced indicator are the automatic search for signals by AO and AC and the release of the working space (getting rid of AO and AC at the bottom of the screen). However, in many cases, the need for AO and AC exists. Therefore, we have added hotkeys that instantly show and hide the indicators at the bottom of the screen.
- Shift + Q - Displays both AO and AC at the same time
- Shift + W - Hides AO and AC
- Shift + E - Displays AO
- Shift + R - Displays AC
The first time you press the keys on the chart, the standard AO and AC indicators will be displayed with standard settings and colors. If you want your customized indicators to be displayed within the Bill Williams Advanced indicator, then follow these conditions:
- add AO and AC indicators
- manually customize colors
- press hotkeys
Special Blue Light
Squares with signals can be outlined in blue or yellow.
Blue color means that the signal is still active and you can enter it at a better, more favorable price.
Yellow color indicates that the entry on the signal has already occurred. At the same time, you can see where the price is in relation to the high/low of the bar. In some cases and in such situations, it is not too late to enter the trade.
Attention! The indicator is recommended for use only by those people who are familiar with the Bill Williams Profitunity system. In particular, it is necessary to pay attention to the filtering of signals using the Alligator and Fractal indicators.
External parameters
- coordX - position of the panel along the X axis
- coordY - position of the panel along the Y axis
- Columns - number of columns (you can choose from 5 to 10)
- Tracing - panel stroke color
- FontAOACColor - font color of AO and AC signals
- FontAOACType - font type of AO and AC signals
- FontZonesColor - zone font color
- FontZonesType - zone font type
- ZoneUPcolor - ascending zone color
- ZoneDownColor - the color of the downstream zone
- NoZoneColor - no zone color
- LongLessThanZero - the color of ascending AO and AC bars below the zero line
- LongAboveThanZero the color of ascending AO and AC bars above the zero line
- ShortLessThanZero - color of descending AO and AC bars below the zero line
- shortAboveThanZero - color of descending AO and AC bars above the zero line
- ApprovedSignalcolor - outline color of the confirmed signal cell
- SpecialBlueLight - color of the "Special Blue Light" signal cell
- ThiknessAS - thickness of the stroke of the cell with the signal
- HeightAOAC - Fixed height of AO and AC indicators at the bottom of the screen






















Становиться без проблем, единственное что нужно от вас - подвинуть по HUDу его и поставить там где удобно и нужно вам. Сигналит, видит, не тупит. Инструкция обязательна к просмотру. Полезен и удобен